

The reigning wisdom was that remote learning, where students learned fully online at home, was hard on students academically and socially/emotionally during the 2020-21 school year. In this blog post we analyze what that looked like for students in terms of academic performance on the Kentucky Performance Rating for Educational Progress (K-PREP) exams in 2021. Examining data from 1,109 schools across the Commonwealth reveals that schools spent, on average, 43% of their days in remote learning contexts. However, some schools spent 0% of days in remote learning and others spent 100% of their time in remote learning contexts. Given the wide range, there is a lot of potential to learn from this data.
It should be noted that the comparisons being made here should be taken with a few major caveats. First, participation in the K-PREP exams was much lower in 2021 than in 2019 so the student makeup of test takers is different. Second, there are a number of schools that were not included in this analysis, particularly for math proficiency. While there are 1,109 A1 schools that were initially included in this dataset, complete data was only available for 886 of them in math and 1,057 in reading. A missing data analysis (in Table 1) shows that missing data is much more likely from schools that spent more time in remote learning, schools with more students who identify as students of color, and students who are economically disadvantaged. To clarify where data is missing throughout the write-up, a count of the number of schools for each analysis is included.
Table 1. Missing Data Analysis

Findings
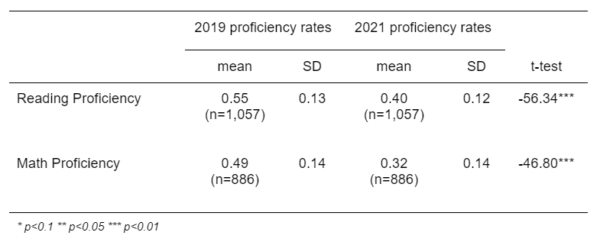
Across the board, student performance on the end of year assessments decreased. The percent of students who scored proficient or distinguished on the K-PREP assessments dropped from 54.8% to 39.7% (-15.1% change) in reading and from 46.7% to 32.1% (-14.6% change) in mathematics among schools included in this analysis.
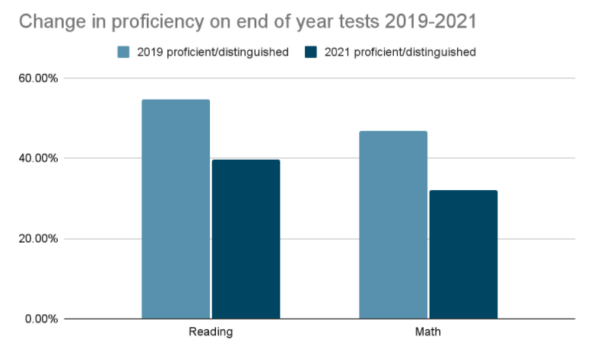
Figure 1
Some have argued that remote learning was a particularly strong force in driving these changes. To test this hypothesis, a comparison of the performance of students in schools that were the most remote to those that were less remote was conducted. The percent of days a school was fully remote was determined. This meant that there was not an in-person learning option for students during those days.
The histogram below shows the distribution of the percentage of days schools were in remote learning. Most schools were remote 30-60% of days during 2020-21, though the distribution is fairly spread.
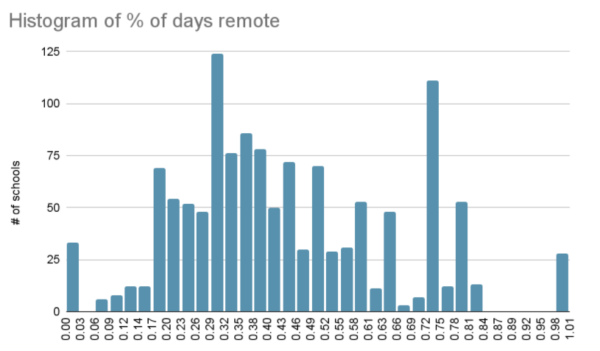
Figure 2
Using the data, schools were divided into quartiles based on the percentage of days a school was in a remote learning setting:
- Quartile 1 includes 271 schools that were remote 0-29.15% of the time.
- Quartile 2 includes 276 schools that were remote 29.15-39.62% of the time.
- Quartile 3 includes 278 schools that were remote 39.62-57.60% of the time.
- Quartile 4 includes 277 schools that were remote 57.60-100% of the time.
Using these quartiles, a comparison of the change in proficiency for math and reading within each quartile was conducted. The graph below shows this.

Figure 3
Schools in quartile one spent an average of 20.5% of their days learning remotely. On end of year assessments, 14.3% fewer students were proficient/distinguished on the math assessment, and 14.6% fewer students were proficient/distinguished on the reading assessment in 2021 compared to 2019.
Schools in quartile two spent an average of 33.9% of their days learning remotely. On end of year assessments, 15.1% fewer students were proficient/distinguished on the math assessment and 15.0% fewer students were proficient/distinguished on the reading assessment in 2021 compared to 2019.
Schools in quartile three spent an average of 46.8% of their days learning remotely. On end of year assessments, 16.7% fewer students were proficient/distinguished on the math assessment and 15.1% fewer students were proficient/distinguished on the reading assessment in 2021 compared to 2019.
Schools in quartile four spent an average of 71.4% of their days learning remotely. On end of year assessments, 20.2% fewer students were proficient/distinguished on the math assessment and 15.1% fewer students were proficient/distinguished on the reading assessment in 2021 compared to 2019.
This initial summary suggests that remote learning had a more negative impact on learning in mathematics than in reading. Reading proficiency dropped by about 15% across all quartiles of remote learning and math proficiency decreased by nearly 6% more for students who were the most remote compared to those who were least remote. But is it statistically significant?
To answer this, the following question was tested:
Are changes in student proficiency rates for math and reading statistically lower among the most remote schools (those in quartile four)?
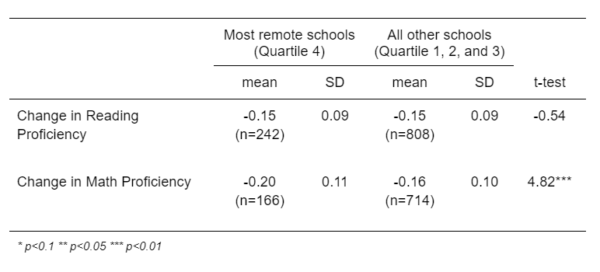
A t-test shows that, compared to all other schools, changes in math proficiency rates were statistically lower for the most remote schools, but changes in reading proficiency were not statistically different. We can say with 99% confidence that the schools that spent the most time in remote learning settings performed lower than their less remote counterparts on the mathematics assessments, but not the reading assessments.
Table 2. Differences in change in proficiency for most remote schools and all other schools
Another way to evaluate the validity of this is to test the extremes: Are changes in student proficiency rates statistically lower among the most remote schools (quartile four) than the least remote schools (quartile one)? The findings from this show largely the same results: More remote learning is related to lower proficiency for math but not for reading.
Table 3. Differences in change in student proficiency for most remote and least remote schools
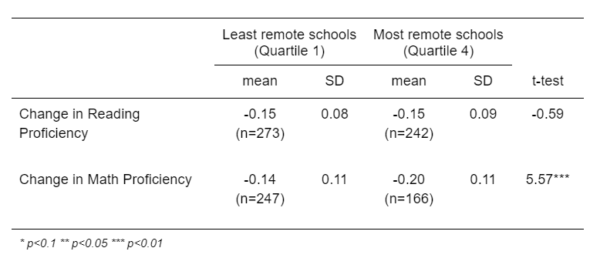
Both tests show that remote learning had bigger effects on student proficiency in math than in reading. However, a 15% decrease in student proficiency statewide is bigger than Kentucky has ever seen. So, while this analysis suggests that remote learning did have significant effects on student math achievement, it’s also clear that COVID-19 had a massive effect on overall student proficiency.
Table 4. Differences in proficiency from 2019 to 2021
Conclusions
While remote learning appears to have played a role in changes in student math proficiency, it’s clear that this does not capture the full story. Table four confirms that student proficiency decreased across the board; COVID-19 disrupted students’ and teachers’ lives in innumerable ways, remote learning or not. We cannot simply mandate “no more remote learning” and “fix” the disruptions in learning that occurred over the past two years.
However, academic assessments also don’t capture the only effects that could have resulted from remote learning. Anecdotally, we have heard that remote learning has led to more social anxiety, disciplinary issues and general difficulty returning to in-person schooling. This analysis does not capture those effects, and it is possible that the “learning loss” is only a fraction of the true loss students have experienced over the course of these past two years.
The hierarchy of needs comes to mind here: If students don’t feel safe, they cannot learn. If they have suffered trauma, as many have, they cannot focus on multiplication tables or reading complex texts. For two years now, our physical and emotional security has been threatened and, of course, it is showing up in student achievement tests. As we move forward with COVID-19 in our lives, it’s important to consider the best mode of teaching and learning as well as the best way to support students and their teachers physically and emotionally so that students can be present in schools as learners.