
Across the Commonwealth, students have two primary opportunities to graduate high school with college credit: dual credit courses or Advanced Placement (AP) courses. Dual credit courses are offered through a partnership between a postsecondary institution and a high school and allow students to earn high school credit and college credit simultaneously. AP courses are governed by the College Board. Students in AP courses engage in the AP curriculum for one academic year and then have the option to take an end of course exam. If they pass the exam, they are eligible to receive credit from a participating college or university.
The state has taken numerous steps to make both AP and dual credit courses accessible to students. Low-income students can have the cost of AP exams subsidized or fully covered by the state. Even with these financial aids, student access to these course offerings is not evenly distributed. For example, if a high school doesn’t offer AP courses, a student can’t take them. So, who has access to AP courses?
Who takes Advanced Placement Courses?
Of the students in the dataset, 34.5%, or 62,016 students in Kentucky, took at least one AP course. Students who took an AP course tended to take multiple AP courses. There are 131,539 students (66.9%), who didn’t take either AP or dual credit courses at any point in their K-12 experience.
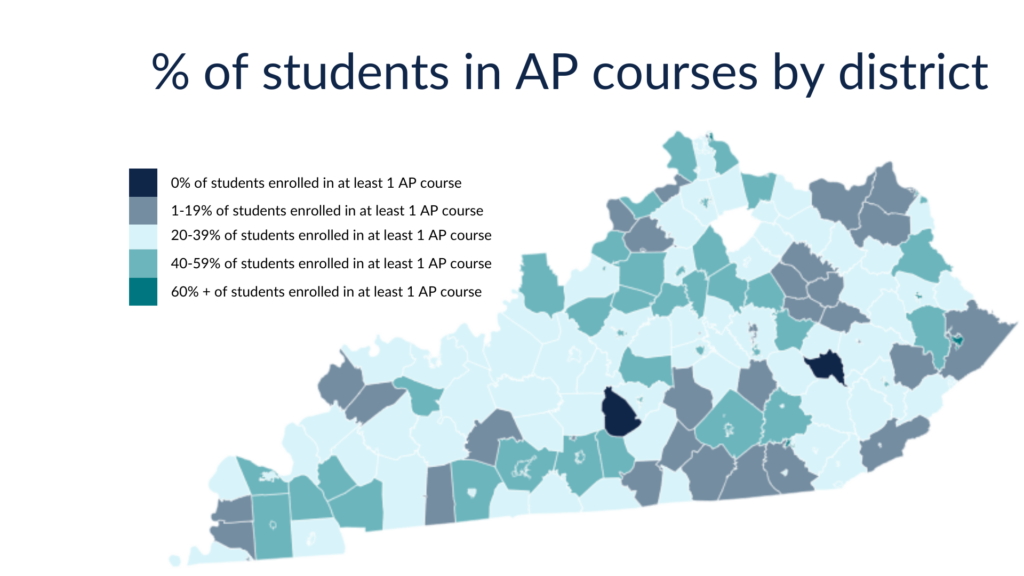
Looking across the state, access to AP courses is not evenly distributed. The map below shows that many districts, shaded light blue, have 20-39% of students who enroll in at least one AP course during high school. However, there are a number of blue shaded school districts (fewer than 20% of students enrolled in one or more AP courses) and a number of green districts (more than 40% of students enrolled in AP courses).
The histogram below shows this distribution. The clustering of districts to the left of the distribution highlights the fact that widespread access to AP courses across a district is limited to few communities.
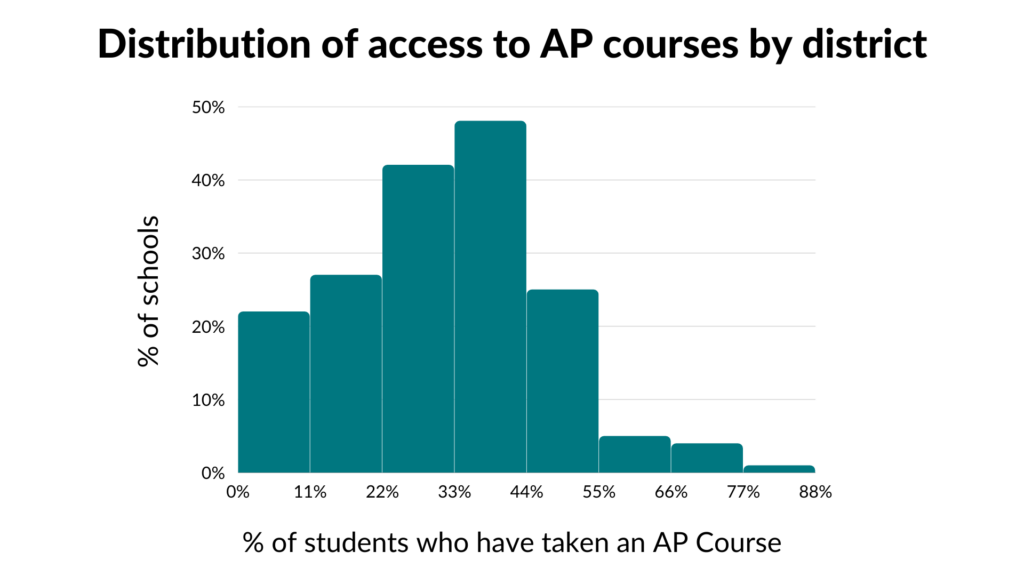
Student AP participation varies widely by district
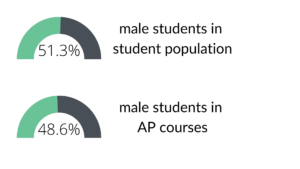
The data also shows AP students are more female than male. This difference is statistically significant and follows national trends: female students are taking more advanced courses than their male peers nationwide. While the student population in the dataset is 51% male, AP courses are only 43% male.
The data also show white students were much more likely to enroll in at least one AP course and much less likely to enroll in any dual credit courses. White students make up 83% of the students in the dataset overall but 87% of AP students. Black students, by contrast, were far less likely to enroll in AP courses. Black students represent 10% of the student population but only 6% of AP students. Interestingly, the racial makeup of students who did not access any advanced courses closely reflects the broader student population.
| Student Race | All Students | AP Students | Students not in advanced courses |
| American Indian | 0.2% | 0.2% | 0.2% |
| Asian | 1% | 2% | 1% |
| Black | 10% | 6%* | 11% |
| Hawaiian | 0.1% | 0.1% | 0.1% |
| Another race | 2% | 1% | 3% |
| Multiple races | 2% | 2% | 1% |
| Unknown race | 1% | 1% | 1% |
| White | 83% | 87%* | 82% |
* indicates a meaningful difference difference between AP students and the broader population
In addition to race and gender, there are other student groups to consider which we can examine based on the additional services they may receive. For example, the percentage of students who receive free or reduced cost lunch can be used as a proxy for the percentage of students who live in poverty. Overall in the data, 49% of students received free or reduced cost lunch. Among AP students, only 32% of students received free or reduced cost lunch. Among students who did not enroll in any advanced course offerings for college credit, 57% of students received free or reduced cost lunch. This suggests that AP courses are not as accessible to low income students. This could be due to course offerings, tracking or lack of awareness about the courses and their advantages. AP courses also have fewer students that received special education services during their high school careers. There are roughly equivalent proportions of students who receive 504 plans and who identify as immigrants.
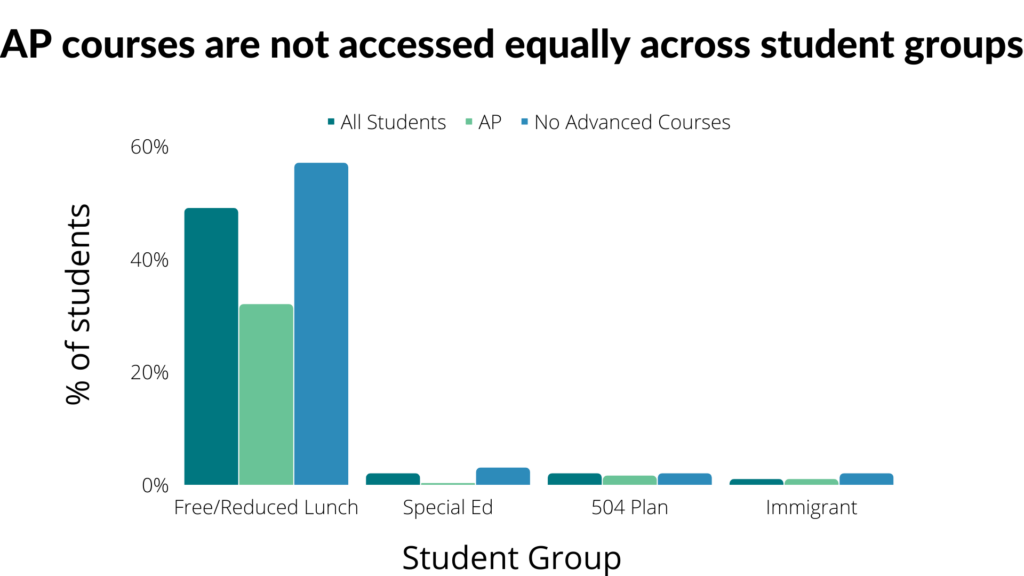
AP Courses are not accessed equally across students groups
Does access matter?
The data above show that access to AP courses is not equitably distributed. AP courses are not equally accessible to minority students, low income students and students with disabilities. This follows national trends.
An initial look at the data shows that students who take AP courses perform better on their ACT and are more likely to graduate high school than their peers who do not take AP courses (see graphics below). Is this because AP courses are leading to higher outcomes or because students who take AP courses are already on track to graduate and be successful on these measures? Future research will use more sophisticated modeling to provide insight into whether AP courses cause these outcomes or if there are systemic forces that contribute to these trends. We will uncover whether, as Brandon Wright from the Fordham Institute posits, “the real problem is not Advanced Placement, it’s everything that comes before it.”
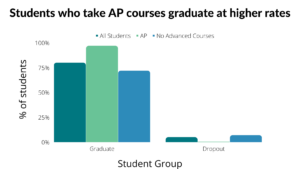
Students who take AP courses graduate at higher rates and dropout at lower rates.
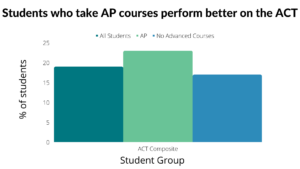
Students who take at least one AP course perform better on the ACT than students who have not taken any AP courses.