

The Kentucky Department of Education’s Strategic Planning and Research team is excited to launch the KDE Research Blog—a new online resource dedicated to sharing research, data, and strategic insights on the issues shaping education across the Commonwealth.
New articles will be published approximately every two weeks, offering research-based perspectives, practical resources, and data visualizations designed to support educators, school and district leaders, policymakers, and anyone interested in Kentucky education. The Research Blog webpage will serve as a central hub where readers can explore the latest posts as well as past blog series and archived articles.
The inaugural series explores one of Kentucky’s most pressing educational challenges—chronic absenteeism. Through research, data, and real-world examples, the series examines how attendance has changed since the pandemic, the factors driving chronic absenteeism, and the statewide efforts, partnerships, and policy changes helping schools reconnect students and improve attendance outcomes.
If you work in the field of education or are the parent or guardian of a student in Kentucky public schools, chances are you don’t need another article explaining what chronic absenteeism is. You have likely heard it discussed in meetings or seen it in school communications and newsletters, or experienced the impact of it in the classroom.
But even for those who have followed the issue closely, it can be hard to understand the true scale of the problem. While many students attend school regularly, far too many miss school enough to place their academic success, future opportunities, and their sense of belonging at risk.
Chronic absenteeism was an important issue before the pandemic, but it wasn’t a widespread one. What used to be an isolated challenge, largely focused on the most vulnerable students, has evolved into a much broader issue. Kentucky now faces a statewide challenge that touches nearly every school, district, and community, with more students than ever missing 18 or more days of school in a year, enough to be considered chronically absent. From a purely instructional standpoint at the low end of chronic absenteeism, missing just 18 days of school over the course of a year—whether the absences are excused or unexcused—is almost a month of lost instruction.
Understanding how we got to this place—and what the data tell us about where we are headed—is an important step towards fixing the problem.
How COVID-19 Reshaped School Attendance
Surging chronic absentee rates aren’t unique to Kentucky, but our numbers are jarring. Before the pandemic, Kentucky’s chronic absentee rates ranged from 17-18%. Following the COVID-19 disruption, Kentucky saw rates climb to nearly 30%—that’s almost one in three students.
While the state has seen some improvement in recent years, with rates falling from 28% in school year (SY) 2023-2024 to 25% in SY 2024-2025, a high percentage of Kentucky schools continue to see alarmingly high levels of chronic absenteeism. This prompted the Kentucky Department of Education (KDE) to address the challenge in the KDE Strategic Plan with the goal of reducing these numbers down to below pre-pandemic levels by the end of the 2028-2029 school year.
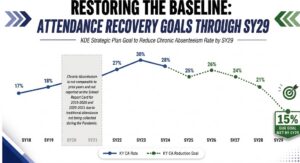
Figure 1: Kentucky chronic absentee rates by year. Illustrates KDE strategic trajectory mapping historical chronic absenteeism rates and the projected path toward a 15% target by SY29.
Research shows that chronic absenteeism isn’t just a problem for the students who are missing class. In response, teachers must often adjust by slowing down pacing, repeating content, and pausing progress for both students who are missing school and those in regular attendance just to catch students up.
When we consider these reactive practices in light of staggering shifts in our school level patterns since the pandemic, we can gain a better idea of just how many students and teachers chronic absenteeism impacts. Pre-pandemic rates (SY 2017-2018) showed only 5% of Kentucky schools had chronic absenteeism rates that were either high or extremely high (≥ 20%). Our most recent reportable data (SY 2024-2025) shows that number skyrocketed to 78% with half of the schools in the state being classified as being in the extreme absenteeism category.
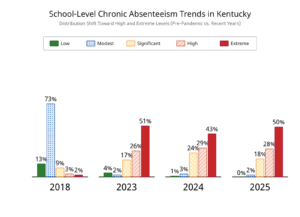
Figure 2: School level chronic absentee rates by year. Illustrates distribution changes since the pandemic. Since the end of SY(2017-2018), the distribution has shifted dramatically away from low and modest rates toward high and extreme levels of chronic absenteeism.
Beyond State Averages
These shifts also highlight limitations in only looking at statewide averages. We know that chronic absenteeism does not affect all students or schools equally, unfortunately hitting our most vulnerable communities the hardest: students dealing with poverty, housing instability, disabilities and mental health crises. While the decline in the overall state average is promising, looking merely at the overall rate can mask significant disparities among student groups and school locations.
While the numbers tell an important story, that story is incomplete. A single data point can’t capture the complexities facing our students and families causing those absences. What is clear, standard attendance policies alone likely won’t fix the problem.
This post is just the first in a series intended to move the conversation beyond the data around chronic absenteeism toward shared understanding that requires multiple perspectives. Across Kentucky, schools and districts are responding in different ways, shaped by local context, needs and a challenge that does not look the same in every community. In part two of this series, we’ll move from numbers to solutions by highlighting current state-level efforts to combat chronic absenteeism, including attendance campaigns and KDE’s partnership with the Regional Educational Laboratory (REL) Appalachia for a pilot project with five school districts in eastern and southeastern Kentucky.
Interested in learning more about how chronic absenteeism is defined and measured? KDE’s attendance resources provide a more detailed explanation.
*Note: Data for figures were sourced from the Kentucky Department of Education reports; AI tools were used for visual formatting enhancements.