

As a former teacher, I used to imagine the ideal arc of my teaching career. Entering the profession the fall after finishing my teacher preparation program, being in a classroom for 27 years and then retiring after a long and fulfilling career, hopefully in the same school–in my case, the high school I graduated from.
For some teachers in Kentucky, this imagined arc becomes reality. For many others, however, their careers take different paths. Some move to another school or district. Some leave teaching for another career. Others leave the state of Kentucky altogether.
Some movement is expected in any workforce. But teacher turnover matters because schools depend on stable teams of educators to build relationships with students and communities, to collaborate with colleagues and to sustain teaching and learning over time. Research has also found that higher levels of teacher turnover can negatively affect student achievement, even if the student’s own teacher does not leave.1
In our last post, we examined the many ways teachers shape students’ academic learning, sense of belonging and development of essential skills that last beyond the classroom. As we turn toward teacher retention, we first need to understand what turnover actually means.

Understanding Stayers, Movers and Leavers
Teacher workforce researchers often describe teachers as stayers, movers or leavers. Stayers remain teaching in the same school from one year to the next, movers continue teaching but move to another school and Leavers leave the teaching profession altogether.2
These distinctions offer important nuance because a teacher can leave a school or district without leaving Kentucky’s teacher workforce. A teacher who moves from School A to School B creates turnover for School A, but as a state, we have not necessarily lost that educator.
In Kentucky, these distinctions also show up in our various reporting methods. The School Report Card turnover tells us about teacher movement out of individual schools, while statewide workforce data help show whether educators remain in K–12 instructional roles. Because those measures answer different questions, their percentages are not directly comparable.
The difference becomes especially important when we look at the numbers.
What Do Kentucky’s Data Show?
At the school level, Kentucky has experienced substantial teacher movement in recent years. Kentucky School Report Card data show school-level teacher turnover rates of roughly 22% to 25% between the 2022–2023 and 2024–2025 school years.3
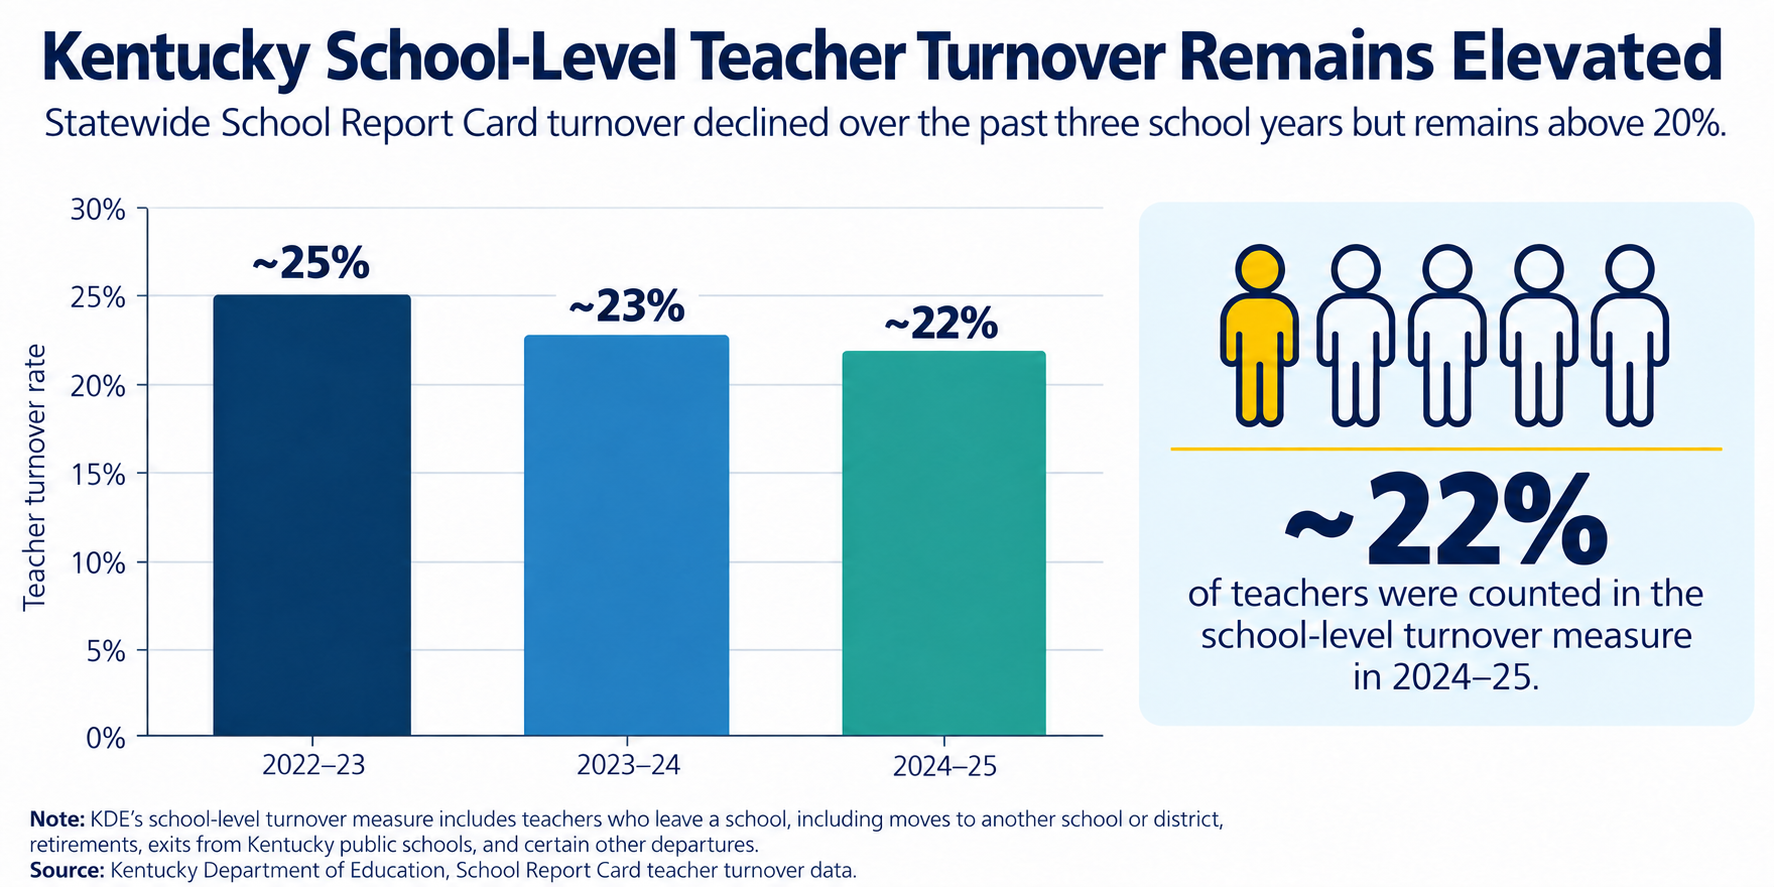
Figure 1. Kentucky school-level turnover remains elevated in recent years. Kentucky school-level teacher turnover remains elevated but declined from approximately 25% in 2022–2023 to approximately 22% in 2024–2025. School-level turnover includes teachers who leave a school, including those who move to another school or district, retire or otherwise leave their position. *Infographic layout and illustrations assisted by AI.
These data do not mean that roughly one-quarter of Kentucky teachers are leaving the profession each year. Kentucky’s school-level measure includes teachers who do not return to the same school. Regardless of the reason a teacher moves to another school, retires or
otherwise leaves their position, our school-level measure is best understood as a measure of staffing stability within schools.
Looking at Kentucky’s Teacher Workforce
The statewide workforce tells a somewhat different story. When the question shifts from whether teachers remain at the same school to whether they remain somewhere in Kentucky’s K–12 instructional workforce, the share counted as exiting is lower. That is because teachers who move between Kentucky schools still remain part of the statewide workforce. Looking at both measures helps distinguish instability within individual schools from losses to Kentucky’s teacher workforce overall.
So Teacher Turnover Remains Elevated–Why Should We Care?
Teacher turnover is more than just a workforce statistic. When teachers leave schools, the effects can reach students, colleagues and the broader school community.
Research from the Learning Policy Institute (LPI) suggests that turnover can disrupt student learning and school continuity, create staffing shortages, increase workload and stress for remaining teachers, and carry significant financial costs for districts, with an average estimated cost of $25,000 per lost teacher for large districts. These costs are the result of separation processes between the teacher and the school or district, as well as money spent on onboarding newly hired teachers and their ongoing professional development. This is funding that could instead be directed to other budgetary needs that enrich student experiences. These effects are also not distributed evenly: nationally, turnover rates are higher in schools serving larger concentrations of students of color and students from low-income backgrounds.4
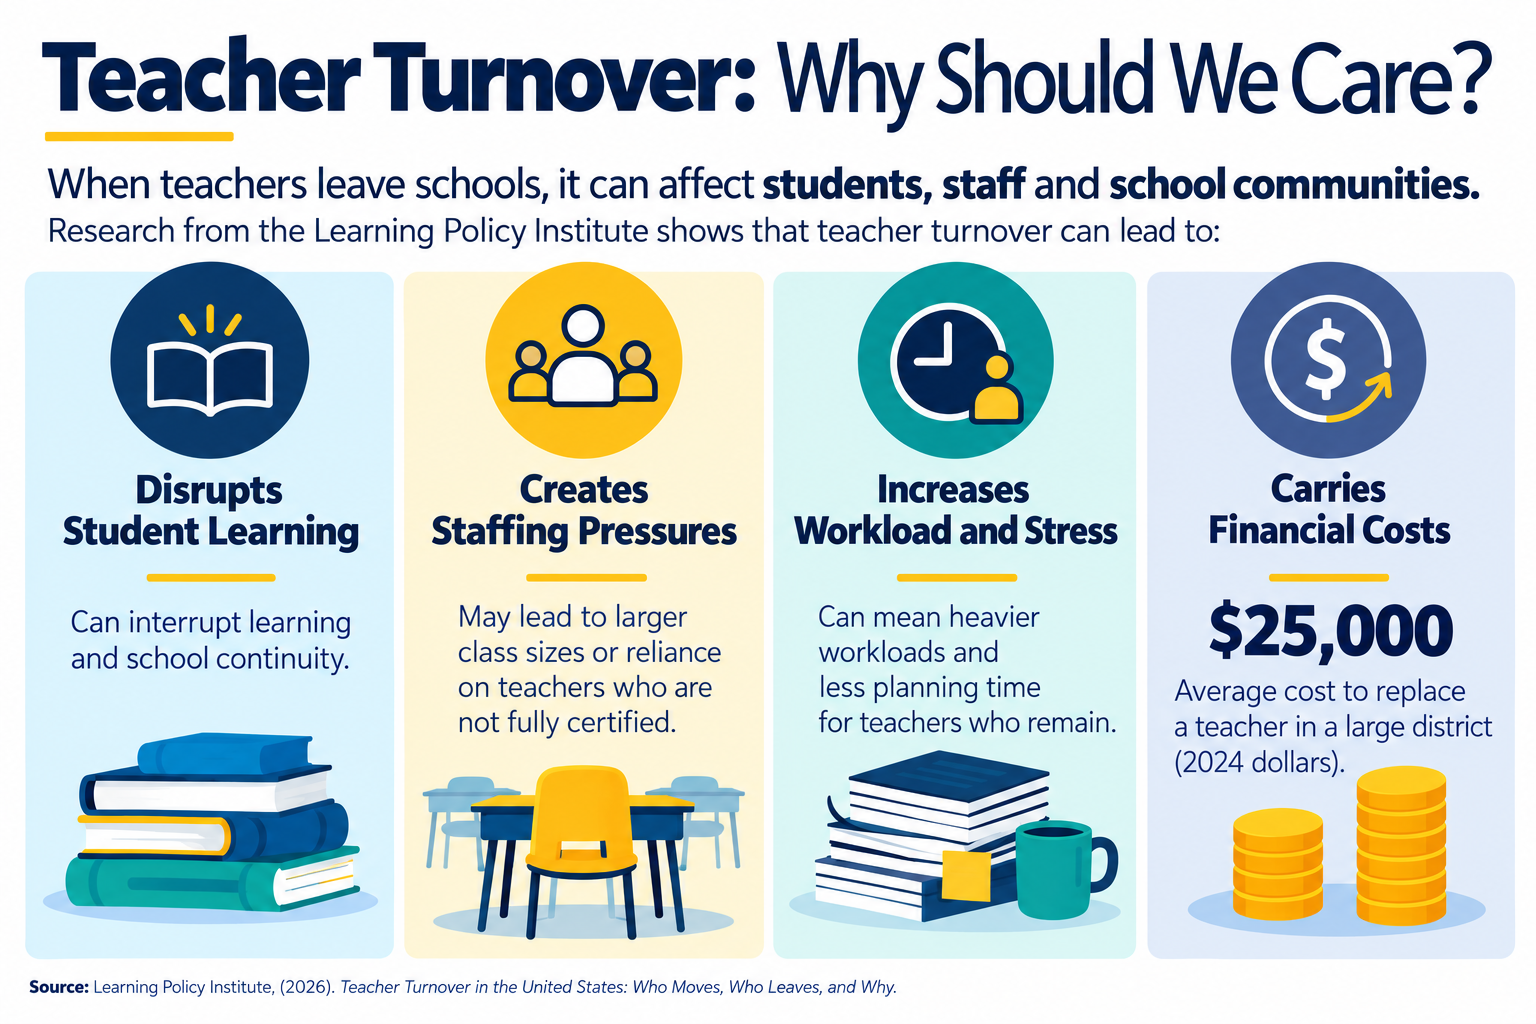
Figure 2. Teacher turnover can affect students, staff and school communities. Teacher turnover can disrupt learning, create staffing pressures, increase workload and stress for remaining teachers and impose financial costs on school districts. The Learning Policy Institute estimates that replacing a teacher can cost about $25,000 on average in a large district. *Infographic layout and illustrations assisted by AI.
These consequences help explain why teacher turnover is worth paying attention to. But while turnover data can help us understand what is happening, they cannot, on their own, explain why.
Why does one teacher build a career in the same school for decades while another moves to a neighboring district? Why does another leave the classroom altogether? And what conditions make teaching a career that educators can sustain?
Those are the questions we will explore throughout the rest of this series.
Coming Up in the Series
In our next post, we’ll examine teacher compensation and the “adequacy gap”—looking at how Kentucky teacher salaries compare with other professions requiring similar levels of education and preparation, how teacher pay has changed over time and what compensation data can tell us about the economic conditions of the teaching profession and their relationship to retention.
Join the Conversation
What conditions or experiences do you think matter most in whether a teacher stays, moves or leaves?
1 Ronfeldt, et al. (2013). How Teacher Turnover Harms Student Achievement. American Educational Research Journal. Access the article here.
2 National Center for Education Statistics. Teacher Follow-up Survey: Stayers, Movers and Leavers. Access the NCES Teacher Follow-up Survey for more information.
3 Kentucky Department of Education (2026). Kentucky School Report Card Teacher Turnover Data. Access the Kentucky School Report Card data.
4 Learning Policy Institute (2026). Teacher Turnover in the United States: Who Moves, Who Leaves, and Why. Access the full Learning Policy Institute article for more information.