

In 2021, the Office of Teaching and Learning at the Kentucky Department of Education sought answers to two questions:
- Access: Who has access to advanced placement course offerings?
- Efficacy: Do advanced placement courses lead to differences in student outcomes?
In a prior post, we analyzed question 1 and found that access to advanced placement (AP) courses is not evenly distributed. Students who are historically disadvantaged are less likely to have access to AP course offerings. So, while AP students outperformed non-AP students on measures like the ACT exam and graduation rate, we wanted to dig further into whether AP courses led students to perform better or if AP courses were selecting students who would always perform better. This post aims to answer question two and establish whether or not this difference is causal.
We answered this question in three progressive stages: (1) by looking at the raw averages, (2) through a regression analysis, and (3) through propensity score matching models. Through the course of this analysis, our aim was to understand what the true effect of AP courses is on ACT scores.
The Data
In this study we use student level data from the Kentucky Department of Education’s data system, Infinite Campus, and school level data from the school report card. We included students who were born between 1990 and 1997, who started high school between 2009 and 2012 and who finished high school by 2017. This left us with 208,735 possible students.
In this sample:
- 31.4% took at least one AP course (were an “AP Student”)
- 47.1% received free or reduced price lunch
- 11.7% received special education services
- 51.8% were male and 48.2% were female
- 32.7% lived in a rural district
- 18.2% lived in an urban district
- 5.1% were hispanic
- 10.7% were Black or African American
- 82.7% were White
As discussed at length in the previous post, AP students do not look like the rest of the student population. They are more likely to be female, white, and from a more advantaged background. They are also more likely to have qualified for gifted services and less likely to have received special education services. Table 1 highlights some of these key differences.
Table 1: Sample demographics by AP participation
|
AP Student |
Not AP Student | |
| # of students |
67,822 |
122,580 |
| Male |
46.9% |
56.4% |
| Black |
7.4% |
13.1% |
| Another race |
1.2% |
3.1% |
| White |
85.9% |
80.1% |
| Hispanic |
5.2% |
5.3% |
| Gifted |
34.8% |
10.4% |
| IEP |
1.9% |
11.6% |
| FRL |
35.5% |
57.6% |
ACT Performance
Students who took at least one AP course performed measurably better on the ACT exam. AP students scored, on average, a 22.7 on the ACT exam and non-AP students scored, on average, a 16.9. This is a difference of 5.8 points.
However, taking the difference in the average does not account for the fact that AP students are different from non-AP students. Perhaps, for example, their ACT composite score is not due to their exposure to AP coursework, but instead because they had access to the best tutors and resources to support their studies. Doing a regression analysis allows us to control for multiple factors at once and to gauge the “true” effect of AP courses on ACT performance.
In the regression analysis we controlled for gender, race, whether a student received free/reduced price lunch (a proxy for socioeconomic status), average of past performance on End of Course (EOC) exams, community setting (urban, rural, etc), and school-level fixed effects. AP participation is correlated with a +3.9 increase in ACT Composite score even after controlling for these factors. In addition to AP participation, higher performance on EOCs, receiving a gifted label, and being in a suburban or urban district are positive predictors of ACT composite. By contrast, receiving free/reduced lunch, receiving special education services, and race was predictive of lower ACT composite scores. Gender, being in a rural school, and various racial groups had statistically zero effect on ACT scores. This suggests that other factors explain some of the 5.8 point difference and that the effect of AP participation is closer to 4 points.
Figure 1: The effect of AP participation on ACT Performance regression results

Propensity Score Matching allows us to pair similar students, one of whom took AP and one of whom did not, and uncover the difference in ACT performance between those near identical matches. In short, it allows us to make a better comparison between students. When using this approach, we matched students on past academic performance, gender, race, whether they received free/reduced price lunch, receipt of gifted or special education services, community setting, and ethnicity. After matching, we found similar results to the linear regression model: the difference between AP students and their matched non-AP students was 3.6 points on the ACT Composite. AP students scored, on average, 22.7 points and their matched, non-AP counterparts scored 19.2. Now, as the table below showcases, the students in the AP group and non-AP group are much more similar after matching.
Table 2: Sample demographics by AP participation after matching
|
AP Student |
Not-AP Student |
|
| # of students |
46,139 |
73,082 |
| EOC % ** |
70.8% |
70.2% |
| Male |
43.6% |
43.2% |
| Black |
6.5% |
6.7% |
| Another race |
0.9% |
1.2% |
| White |
86.8% |
85.8% |
| Hispanic |
5.0% |
5.4% |
| Gifted |
42.3% |
42.8% |
| IEP |
1.8% |
1.7% |
| FRL |
33.2% |
33.9% |
| MEAN BIAS: 1.4% | ||
In addition to matching the full sample, we stratified students by academic achievement levels. This allowed us to see whether the effect of AP courses on ACT performance was different for different types of students. To do this, we divided students into five groups based on their average EOC performance. We then matched AP students with three of their nearest neighbor students, or, those who look most similar to them. After matching in each of the five groups we found the following: AP courses had a positive, significant effect on all five groups. The average treatment effect on the treated students was 3.16 points on the ACT Composite. However, the group was smaller for the top achievers.
Table 3: Propensity Score Matching results for ACT composite score, stratified by prior academic achievement
| AP Students | Non-AP Students | DIFFERENCE | |
| Quintile 1 | 21.96 | 18.27 | 3.69*** |
| Quintile 2 | 21.62 | 18.50 | 3.12*** |
| Quintile 3 | 23.41 | 19.54 | 3.87*** |
| Quintile 4 | 20.98 | 17.49 | 3.49*** |
| Quintile 5 | 23.81 | 22.16 | 1.65*** |
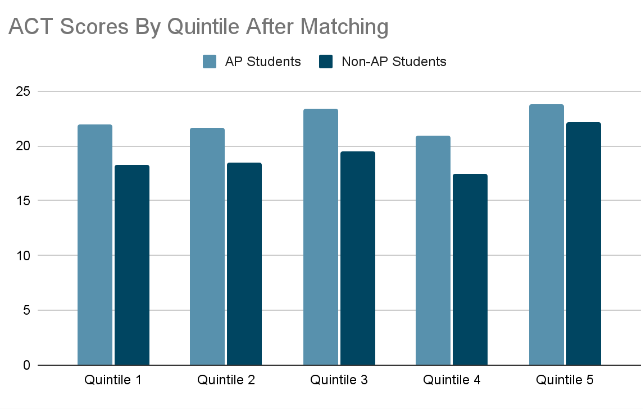
Notably, the ACT College Ready benchmark is, on average, 21. Across all groups and all models, AP students consistently scored above the college ready benchmark and non-AP students (except those students in the top achiever group) scored below the college ready benchmark.
Policy Implications and Next Steps
The data and analyses presented here suggest that AP course participation has a positive, significant effect on student performance on the ACT exam. While this is merely one measure, it is a measure used nationwide to assess college-preparedness and can provide useful insight.
The results suggest that there would be positive benefits for all students if access to AP courses were expanded. However, we know that it isn’t as simple as saying “everyone take an AP course now!” There are real structural and systems-level barriers to statewide implementation of these programs. For example, staffing and scheduling in small school systems may make it difficult to offer AP courses for students. If you are a small school district with one high school and only one social studies teacher, there may not be sufficient class periods to offer all of the required social studies courses AND an AP offering in social studies, for example.
The data also suggests some evidence of tracking. If students don’t have access to the necessary prerequisites, they cannot enroll in an AP class, even if it’s offered. Funding may also be a barrier – teacher training for AP courses and covering the costs of AP exams in a district is not a small expense.
As we consider the best way forward, there is also probably a need for further analysis. Since the time period that these data were collected, Dual Credit has become more accessible for students than ever before. A study that looks at more recent outcomes and considers the effect of dual credit versus AP courses may be helpful in making an informed investment. Additionally, a cost-benefit analysis may be worth considering to gauge the expense in terms of real, measurable outcomes for students.
In short, there is evidence that exposure to the rigorous coursework in advance placement settings has a positive effect on student ACT performance. State policymakers should further explore this connection to understand whether and how to expand access and make these programs more beneficial for all students across the Commonwealth.